A pod that uses 120 millicores of CPU can still keep an expensive node alive if its request is 1,000m. Kubernetes rightsizing closes that gap, but only when teams protect latency, availability, and recovery behavior while reducing unused capacity.
Effective resource allocation depends on requests, limits, actual resource utilization, and node capacity. These values answer different questions. Treating them as interchangeable produces cheaper-looking Kubernetes manifests and less reliable services.
A sound program starts with measurement and workload-based safety margins for Kubernetes cost optimization. It reduces over-provisioning without sacrificing reliability, then rolls out changes with clear ownership.
Key Takeaways
- Kubernetes rightsizing reduces waste by aligning resource requests and limits with observed workload demand, while protecting latency, availability, and recovery behavior.
- Requests determine scheduling and node capacity, limits govern runtime consumption, and utilization provides evidence for change; these values should not be treated as interchangeable.
- Use representative metrics, percentiles, workload context, and validated safety buffers to size CPU and memory rather than relying on averages or isolated outliers.
- Coordinate VPA, HPA, and node autoscaling carefully because each control loop changes a different capacity dimension and can affect the others.
- Apply recommendations through GitOps, staged rollouts, and clear ownership, then measure both infrastructure savings and reliability outcomes.
Kubernetes rightsizing must protect service reliability
FinOps teams often find waste in low average resource utilization. However, average CPU can hide short bursts that affect queue depth or p99 latency. Average memory can hide a garbage-collection cycle, cache warmup, or month-end batch run.
The goal of resource optimization is to reduce avoidable allocated capacity while holding service objectives steady. Cost reduction follows when workloads pack onto fewer nodes and node autoscalers can remove capacity safely.
Start with a workload risk profile
Group workloads before proposing changes. A stateless API with an HPA has different sizing needs than a stateful database, a JVM service, or a batch job with a fixed deadline.
Production tiers also need different rollout rules. A customer-facing checkout service may need a longer observation window and a canary release. A non-critical report generator can tolerate a more aggressive test cycle.
For each workload, record its owner, service-level objective, scaling method, disruption budget, and traffic pattern. Evidence from Amazon Managed Service for Prometheus can help validate that profile beyond a CPU chart.
Tie savings to a scheduling outcome
Cloud providers bill for worker capacity, not for a pod’s unused request. A lower request produces savings only when it changes scheduling enough to avoid a node addition, release a node, or allow a cheaper node shape.
Rightsizing also improves bin-packing. Large requests leave unusable gaps across nodes, creating node fragmentation when no pending pod fits the remaining CPU or memory. Evidence-based request changes in Kubernetes manifests can reduce those gaps, although anti-affinity rules, topology constraints, and daemon sets may still block consolidation.
Separate requests, limits, utilization, and allocatable capacity
Each value has a different role in resource allocation. Confusing them is the fastest path to a failed optimization review.

Requests determine where a pod can run
A CPU or memory request is the scheduler’s planning value. Kubernetes places a pod only when a node has enough allocatable resource for its effective request, alongside its other scheduling requirements.
For a multi-container pod, inspect the resource requests and limits in the Kubernetes manifests. Calculate the effective values from application-container settings, the largest relevant init-container setting, pod overhead, and every sidecar. A service mesh proxy or log collector can materially change a pod’s footprint.
Allocatable capacity is the portion of a node available to pods after resources reserved for the operating system, Kubernetes components, and eviction thresholds. It is lower than the machine’s raw CPU and memory capacity. The Kubernetes resource management documentation explains how these settings affect scheduling and runtime behavior.
Limits govern runtime consumption
A CPU limit caps CPU time through the container runtime’s control groups. When demand exceeds that cap, the container can experience throttling rather than a clean failure. Latency-sensitive applications may suffer even when CPU usage graphs look moderate.
A memory limit is different. Memory can’t be safely throttled in the same way. When a container crosses its effective memory limit, the kernel can kill a process. Memory limits need careful testing around startup, cache growth, and peak concurrency.
Requests and limits also affect Pod Quality of Service. A Pod reaches the Guaranteed class only when every container has matching CPU and memory requests and limits. Kubernetes documents the eviction implications in its Pod QoS class reference.
Build a representative utilization history
Build a representative history of resource utilization across the workload’s normal operating cycles.
A seven-day chart may be enough for a steady internal service. It rarely captures historical resource usage shaped by payroll runs, regional traffic peaks, release events, or quarterly reporting.
Use Prometheus and Grafana, or a compatible long-term metrics store such as Amazon Managed Service for Prometheus, to capture container resource metrics: CPU, memory working set, pod restarts, throttling, replica count, and node pressure. Set retention in Amazon Managed Service for Prometheus to cover the full observation window, and keep deployment timestamps in the same dashboard. A major code release can make older measurements misleading.
Measure the right signals at the right level
CPU usage is a rate, often expressed in millicores. For a container using 0.24 CPU cores during a five-minute window:
CPU usage in millicores = 0.24 x 1,000 = 240m
Memory is a point-in-time value. Container working set is usually more useful for capacity planning than a raw total that includes easily reclaimable cache. Still, it doesn’t replace inspection of heap behavior, page faults, and actual OOM events.
Aggregate resource utilization by workload and container role. Don’t average memory across replicas if one replica consistently receives a larger share of traffic. Likewise, exclude completed Jobs from a long-running Deployment’s baseline.
Look beyond the mean
Use queries in Amazon Managed Service for Prometheus to calculate percentiles that describe normal high demand. P50 shows the middle of the sample distribution, while P95 shows a level exceeded only five percent of observed samples. P99 may be appropriate when rare spikes are service-critical and the observation window is broad enough.
Also review the maximum, but don’t size every service to one unexplained outlier. First check whether it aligned with a deploy, retry storm, backup, traffic surge, or measurement issue.
Open-source tools can serve as a recommendation generator. Robusta KRR queries Prometheus data and produces CPU and memory recommendations, while Goldilocks can expose Vertical Pod Autoscaler recommendations as a starting point. Goldilocks output still needs workload-owner review. Use continuous automation to refresh recommendations only after a complete, validated observation window.
Turn percentiles into requests and limits
Percentile sizing is a decision method, not an automatic setting. Use resource utilization percentiles as inputs, including data from sources such as Amazon Managed Service for Prometheus. Match the selected percentile and buffer to the impact of a miss, scaling speed, and natural variation.
A recommendation generator can turn observed P95 and P99 values into candidate requests. Workload owners still need to validate each buffer, because under-provisioning can occur when it is too small.
For a service with a P95 CPU usage of 240m, a team might select a 25% validated burst buffer:
Candidate CPU request = 240m x 1.25 = 300m
That 25% is an example, not a standard. A service with reliable HPA response may need less static headroom. A workload with bursty startup behavior may need more.
Size CPU for latency and queuing behavior
Set CPU requests from sustained high demand, then watch latency, queue depth, and throttling after rollout. CPU limits need a separate decision because they can create a hard ceiling during a burst.
A multi-tenant platform may require CPU limits to control noisy neighbors. In contrast, teams sometimes omit CPU limits for latency-sensitive services while retaining requests and strong namespace guardrails. That choice needs enough node headroom and a clear admission policy.
HPA CPU utilization is calculated against requests. Lowering a CPU request can make the same workload appear more utilized and trigger scale-out earlier.
Treat memory as a failure-risk decision
Suppose a container’s P99 working set is 760MiB. With a 15% buffer selected after reviewing its peak behavior, the planning value is about 874MiB. A team may round that request to 896MiB and validate a 1GiB limit against cold starts and traffic peaks.
Memory limits should leave room for known high-water events. A limit set just above an average chart can still produce OOMKilled failures during normal variance. Conversely, an inflated memory request reduces node density even if the limit is rarely touched.
Use distinct request and limit values when a Burstable profile fits the workload. Use matching values only when the stronger placement and eviction behavior of Guaranteed is worth the reserved capacity. After validation, commit the chosen request and limit values to Kubernetes manifests.
Diagnose throttling and exit code 137 before resizing
A resource recommendation should never be approved from utilization alone. Correlate exit code 137 with throttling, latency shifts, failed requests, and termination evidence. Use Amazon Managed Service for Prometheus to align metric timestamps with termination and node-pressure events.
Inspect CPU throttled periods and throttled seconds alongside application latency. A container can use less CPU than its request on average yet still hit a CPU limit during short bursts. Raising a request won’t solve a restrictive limit, and raising a limit may only move contention to the node.
Memory incidents need even more care. Check the container’s termination state, previous logs, pod restarts, kubelet events, and node memory pressure.
Exit code 137 means a process received SIGKILL. It often accompanies an OOM event, but the code alone does not prove that memory exhaustion caused it.
Repeated OOMKilled events provide stronger evidence of memory pressure than the numeric code alone. A Pod marked Evicted points instead to node-level pressure. Manual termination and other forced kill paths can also produce code 137.
Before raising memory, establish whether the application exceeded its cgroup limit, the node became pressured, or a deployment changed its allocation pattern. The corrective action differs in each case.
Coordinate VPA, HPA, and node autoscaling
Autoscalers solve different dimensions of capacity. They work best when teams define controller ownership and test each control loop before enabling continuous automation.

VPA changes pod size, HPA changes replica count
Vertical Pod Autoscaler uses observed demand to recommend or apply CPU and memory changes to pods, acting as a recommendation generator. Run it in recommendation mode first, then compare its suggestions with business-cycle demand and incident history. Kubernetes describes its Vertical Pod Autoscaler behavior in detail.
Horizontal Pod Autoscaler adds or removes replicas based on observed metrics. With CPU-based scaling, changing requests changes the utilization denominator and can alter HPA behavior, even when application traffic stays flat. The HPA documentation also supports custom and external metrics. Amazon Managed Service for Prometheus can supply these signals, while KEDA supports event-driven scaling.
Avoid unrestricted VPA updates to CPU requests when HPA targets CPU utilization for the same workload. Test the combined control loop first, treating KEDA-managed workloads as a separate control-loop case. Use a demand signal such as request rate, queue depth, or latency.
Node autoscaling realizes infrastructure savings
The cluster autoscaler and cloud-provider equivalents add nodes for unschedulable pods and remove eligible underutilized nodes. They react to scheduling conditions, not savings projections, so rightsized requests don’t guarantee a scale-down event.
Pod disruption budgets, topology constraints, local storage, strict affinity, uneven node pools, daemon-set reservations, and node fragmentation can stop consolidation. Review scale-down blockers before reporting projected savings as achieved savings.
Apply changes through GitOps and controlled rollout
A recommendation generator should not receive unrestricted production write access. Route proposed CPU and memory settings through continuous automation in a bounded, reviewable loop, using the same review and deployment controls that apply to application changes.
A useful pull request shows current and proposed values in the Kubernetes manifests, metric window, percentile, selected buffer, recent restart count, HPA status, and expected node-capacity effect. Attach workload dashboards so the owning team can challenge an assumption before it becomes a production incident.
Keep GitOps automation as the source of truth, with a controller such as Argo CD applying reviewed changes.
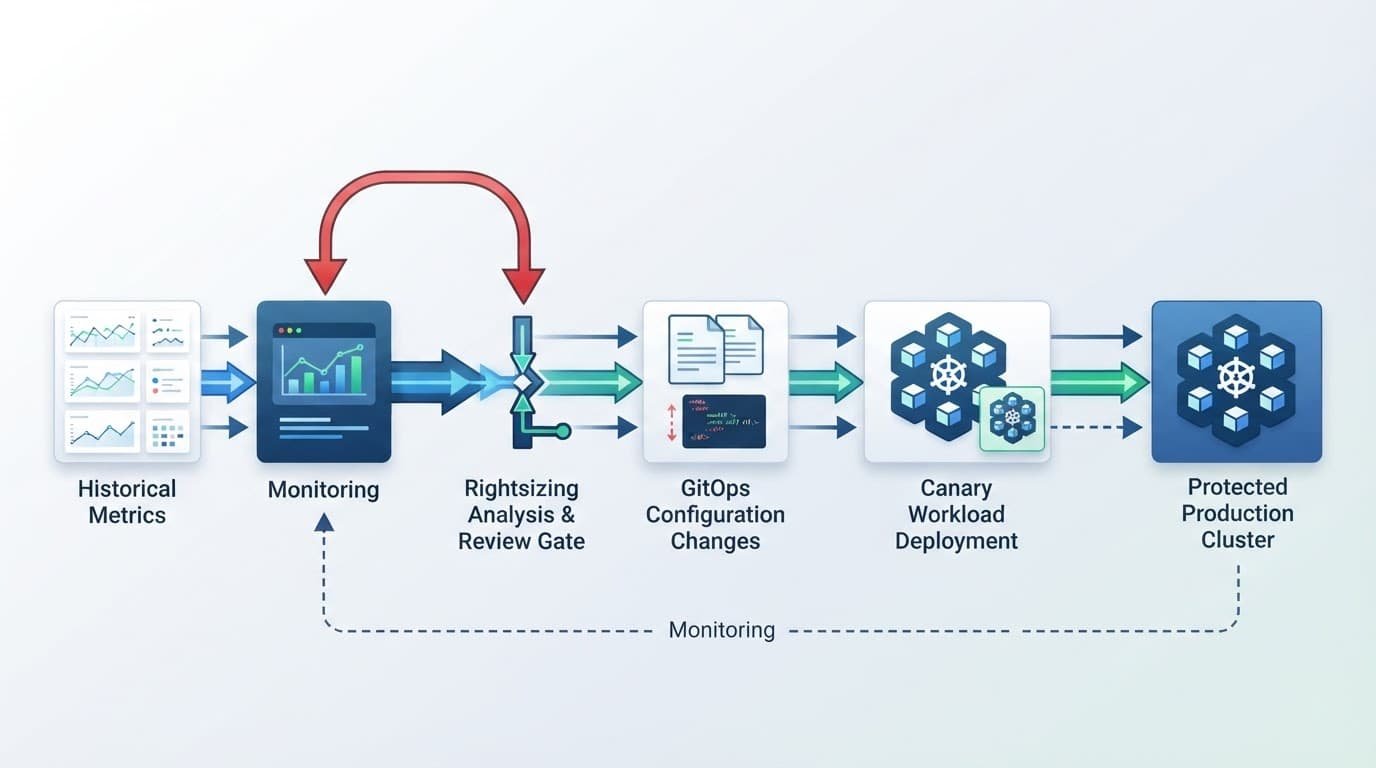
Use a staged workflow:
- Use the recommendation generator to produce recommendations from a completed observation window, and exclude deployments with incomplete or anomalous data.
- Open a pull request for one workload or a small cohort with similar traffic and runtime behavior.
- Deploy to a canary or lower-risk environment. Use Amazon Managed Service for Prometheus data to compare latency, errors, throttling, OOM events, and replica behavior.
- If testing in-place pod resizing, confirm that the supported path works before promotion. Agree rollback criteria with the workload owner and SRE team.
- Confirm the cluster-level result by tracking pending pods, node count, allocatable headroom, and actual infrastructure cost.
A metrics-driven GitOps implementation example from AWS shows how resource recommendations can enter a reviewable delivery path.
A Deployment template change can still create a rolling replacement of pods. The different operation, in-place pod resizing, lets Kubernetes change CPU and memory on a running Pod through the /resize subresource, as described in its container resize task.
Test in-place pod resizing across node operating systems, container runtimes, cgroup versions, and resizePolicy settings. Legacy cgroup v1 nodes may not behave like cgroup v2 nodes, especially when reducing a memory target below current usage.
Establish FinOps controls that developers trust
FinOps owns cost visibility, platform engineering owns cluster guardrails, and application teams own runtime behavior. Keep resource allocation ownership visible across all three teams. A rightsizing process works when those responsibilities remain clear.
Publish recommendations with a confidence level. Low confidence can reflect sparse data, recent releases, frequent restarts, seasonal traffic, or HPA dependencies. Review confidence and exceptions through continuous automation, but give those workloads more observation rather than automatic reduction.
Namespace policies can prevent obvious errors. LimitRange defaults, ResourceQuota, and admission controls help stop workloads from entering production without requests or with implausibly high settings. Policy should still allow exceptions for proven operational needs.
When evaluating commercial platforms such as Cast AI or ScaleOps, ask how each platform’s recommendation generator produces and governs recommendations, and how changes are rolled back. Also verify permissions, data retention, Amazon Managed Service for Prometheus integration, node-scaling support, and treatment of HPA-managed workloads.
Track resource optimization with paired reliability and efficiency measures. Useful indicators include resource utilization, request-to-P95 ratios, throttling trends, OOM frequency, unschedulable-pod time, node-hours, and cost per stable service unit. A lower bill paired with a rising incident rate isn’t a successful optimization.
Frequently Asked Questions
What is Kubernetes rightsizing?
Kubernetes rightsizing is the process of adjusting pod resource requests and limits to better match actual workload demand. The goal is to reduce unused capacity and infrastructure cost without harming latency, availability, or recovery behavior.
How should teams choose CPU and memory requests?
Use representative utilization history, workload risk, service objectives, and high-demand percentiles such as P95 or P99. Add a validated buffer for natural variation, startup behavior, and burst demand, then confirm the result through a controlled rollout.
What is the difference between a request and a limit?
A request is the scheduler’s planning value and determines where a pod can run. A limit controls runtime consumption, so a restrictive CPU limit can cause throttling while a memory limit can result in an OOMKilled process.
Can lowering requests reduce cloud costs immediately?
Not necessarily. Savings occur when lower requests improve bin-packing enough to avoid adding a node, release an eligible node, or enable a cheaper node shape; disruption budgets, topology rules, daemon sets, and fragmentation can prevent consolidation.
How should rightsizing changes be rolled out safely?
Generate recommendations from a complete observation window and route them through a reviewable GitOps workflow. Start with a canary or lower-risk workload, define rollback criteria, and monitor latency, errors, throttling, OOM events, replica behavior, pending pods, node count, and actual cost.
Build Kubernetes efficiency one safe change at a time
Kubernetes rightsizing works when declared capacity reflects observed demand without removing the headroom that keeps services stable. Requests guide scheduling, limits control runtime behavior, and actual utilization supplies evidence for changing either one.
The strongest FinOps programs use percentiles, service context, and controlled rollout gates. Reliable capacity comes from maintaining reliable values in Kubernetes manifests, making cost reduction durable.

